
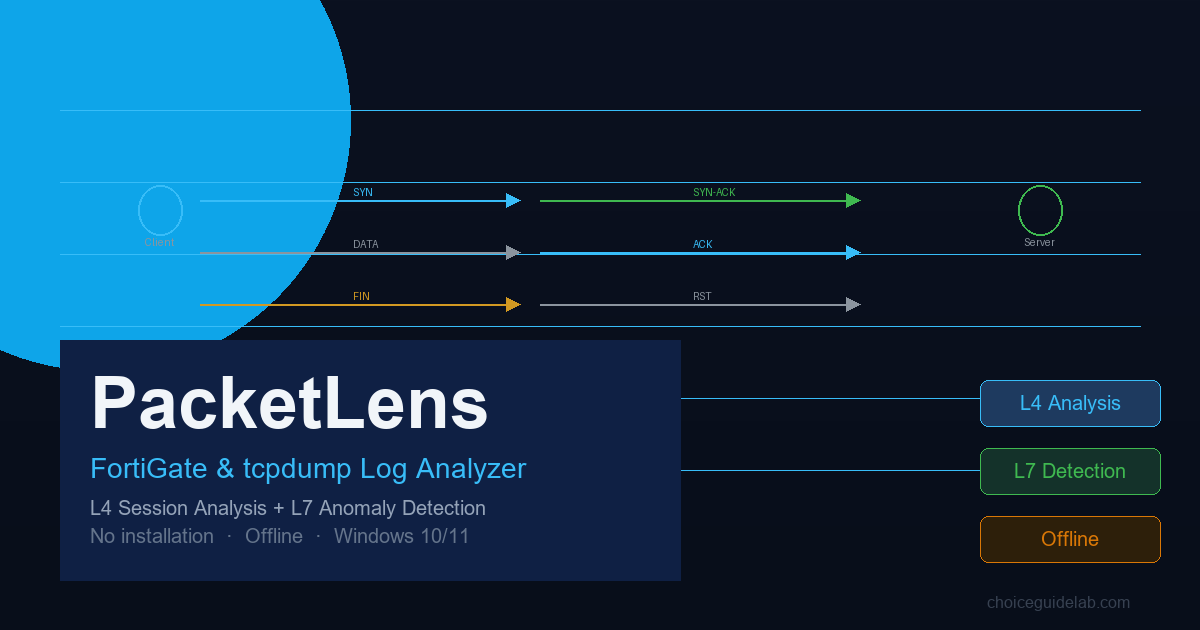
PacketLens is a local, offline traffic analysis tool built for network and security engineers. It accepts FortiGate diagnose sniffer packet output, tcpdump -xx hex dumps, and standard pcap captures, converts them to pcap internally, and returns structured L4 session data and L7 anomaly findings directly in your browser. The entire application runs as a single EXE file — no installation, no runtime dependencies, no configuration.
The tool was built to solve a specific problem: the path from a raw FortiGate capture to a Wireshark-readable pcap used to require a separate conversion script, a local Python environment, and enough familiarity with pcap binary format to know whether the conversion worked. PacketLens replaces all of that with a file drop.
Supported Input Formats — Three Paths In, One Analysis Out
PacketLens detects the file type automatically on upload. There is no format selector, no configuration dialog, and no manual step required.
What you get regardless of input format: the same structured session table and L7 anomaly list, derived from a common pcap intermediate. If you uploaded a text log, PacketLens also makes the converted pcap available for download so you can open it in Wireshark afterward without running any conversion yourself.
L4 Session Analysis — Every TCP Connection, Classified and Measured
The first thing PacketLens does after parsing a capture is reconstruct every TCP, UDP, and ICMP session from the raw packet stream. The result is a session table that tells you the state of every connection, sorted by packet count, with a live filter bar so you can isolate exactly the traffic you are looking for.
I use this view as my first pass on any capture I cannot immediately explain. The state column answers the most common question — did this connection succeed? — without requiring me to read a sequence of packets manually. A table of 400 sessions becomes navigable in seconds when I can filter to SYN_UNANSWERED and see immediately which destinations were unreachable.
Per-session metrics include RTT measured from SYN to SYN-ACK, retransmission count (detected by duplicate sequence numbers), missing response count (SYN with no matching SYN-ACK), packet count, byte count, and session duration. The filter bar lets you narrow by source IP, destination IP, port, protocol, TCP state, or delay flag simultaneously.
What you gain: You replace the manual process of scrolling through thousands of packets looking for a failed handshake with a two-second filter operation. On a 50 MB capture with 1,200 sessions, finding every blocked connection takes as long as it takes to type the destination IP into the filter bar.
Flow Graph — Wireshark-Style Packet Timeline, Per Session
Click any row in the session table and a Flow Graph opens as an overlay. The graph renders a vertical time axis with the client on the left and the server on the right. Each packet in the session appears as a horizontal arrow between the two endpoints, labeled with its TCP flags and size. The time axis runs top to bottom, matching the convention used in Wireshark’s TCP Stream Graph.
This view answers the question that the session table cannot: where in the connection did the problem happen? A session marked RST tells you the connection was reset. The Flow Graph tells you whether the reset happened after a normal data exchange, immediately after the handshake, or before any data was transmitted at all. That distinction matters enormously when you are trying to explain behavior to an application team or write a firewall change request.
What you gain: You can present the exact sequence of events in a connection to anyone on your team — application owner, firewall engineer, or auditor — without requiring them to open Wireshark or understand pcap. The Flow Graph is a self-contained, labeled diagram of what happened. For incident reports and change records, it is the artifact that eliminates the most back-and-forth.
L7 Anomaly Detection — HTTP, DNS, and TLS Analyzed in the Same Pass
After the L4 session pass, PacketLens runs a second analysis over the same pcap to surface application-layer issues. This runs automatically and requires no configuration — the results appear alongside the session table when analysis completes.
The DNS module has been consistently the most valuable part of this analysis. In one recent case, we were debugging an application timeout that the L4 view showed as ESTABLISHED sessions — the TCP connections were succeeding. The L7 panel surfaced 34 NXDOMAIN responses for an internal hostname that had been decommissioned six weeks earlier. The application was retrying on every request cycle. The timeout was a DNS resolution failure, not a network problem. Without the L7 view, we would have spent another hour looking at firewall policy.
What you gain: You surface application-layer issues that are invisible at the L4 level. A session that shows as ESTABLISHED at L4 might be returning 503 errors, querying a non-existent domain on every retry, or negotiating a deprecated TLS version. PacketLens finds these automatically and presents them in a severity-ranked list with full context — source, destination, timestamp, and the exact response code or alert description.
Delayed Sessions and Retransmission Detail — Drill Into What the Summary Shows
The summary cards at the top of the results page are interactive. The Delayed Sessions card shows the count of sessions that exceeded the 200ms RTT threshold or had at least one retransmission. Click it and a sorted table opens with every delayed session, its average and maximum RTT, and its retransmission count. Sessions with an RTT above 200ms are highlighted in red.
The Retransmission Packet card opens a similar view focused on retransmissions specifically. The per-session retransmission rate — retransmissions as a percentage of that session’s total packets — is calculated and displayed alongside the raw count. Sessions above 10% are flagged immediately.
Both tables include a row-level click that opens the Flow Graph for that specific session, so the path from “there is a retransmission problem” to “this is exactly where in the TCP exchange it happened” is three clicks from the results page.
What you gain: Retransmission and delay data that previously required building a Wireshark display filter and manually reading statistics panels is presented in a ranked, filterable table that shows the worst sessions first. For environments with dozens of concurrent connections, this saves significant time during active troubleshooting and produces a clear artifact for post-incident documentation.
Excel Export — Analysis Results in a Workbook You Can Attach to Anything
The Excel export produces a three-sheet workbook. The Summary sheet contains aggregate metrics: total packets, session count, retransmission count and rate, delayed session count, and L7 issue count. The Session List sheet contains the full session table with all computed fields. The L7 Anomalies sheet contains every finding with its severity level, category, description, source, and destination.
This is the artifact I attach to change records, incident reports, and firewall review requests. The workbook format makes it easy for recipients unfamiliar with packet analysis to understand the scope of what the capture showed without requiring access to any specialized tool.
The Excel export requires a one-time license purchase. Analysis, filtering, the Flow Graph, and the direct pcap download are always free.
Run PacketLens in Four Steps
- Download PacketLens.exe using the button below
- Run PacketLens.exe — no installation required; your default browser opens automatically at
127.0.0.1:8000 - Drop your log file into the upload zone — FortiGate sniffer output, tcpdump hex dump, or an existing pcap file
- Review results — session table, L7 anomaly list, Flow Graph per session, delayed and retransmission detail on demand
Why Local Processing Matters When You Are Analyzing Network Captures
A packet capture from a production firewall or server contains source and destination addresses, timing data, and in many cases application payload for every connection in the capture window. That data describes your network topology and application behavior in detail. Uploading it to a cloud analysis service means that data leaves your perimeter. In environments with compliance requirements, that decision requires explicit authorization.
PacketLens processes everything in memory on your local machine. The web server binds exclusively to 127.0.0.1 — it is not accessible from any other host on your network. No analysis data is transmitted. No telemetry is collected. The tool runs without modification in air-gapped environments.
- Fully offline after download — no internet connection required to use the tool
- Server binds to
127.0.0.1only — not accessible from other machines on the network - No telemetry, no update checks, no external requests of any kind
- Compatible with air-gapped and isolated environments
- Supported on Windows 10 and Windows 11 (64-bit)
- Maximum upload size: 50 MB per file
If you work with FortiGate firewall policies and want to analyze your policy table for unused or risky rules, see AI-Policy Optimizer (APO) — a complementary tool for firewall policy review.
Download
PacketLens
Windows 10 / 11 · No installation · Offline
Analysis, Flow Graph, and pcap download are always free ·
Excel export requires a one-time license purchase
Further Reading: For more in-depth information, refer to the official Fortinet Documentation.